
Peer Reviewed
Scale-Based Scores Linked to Health Care Overutilization in Primary Care: Development and Validation of the Q-Scale
Abstract
Objective. This study aimed to develop and validate the Quality-of-Life Scale (Q-scale), a survey-based instrument for predicting patient health care overutilization (HO) by evaluating psychosocial, affective, and somatic factors in a primary care setting. Characterized by frequent urgent care or emergency room visits for non-urgent issues, HO burdens health care resources and impacts overall quality of care provided by primary care physicians.
Methods. The study included 9997 patients, 18 years of age and older, from 13 primary care clinics. The Q-scale, a 10-item computer-based survey, assessed negative affect, positive affect, and somatic factors, producing two primary indices: Q-negative (high-risk) and Q-positive (low-risk) scores. Data analysis involved linear regression, Pearson chi-square tests, and Wilcoxon rank-sum tests to examine associations with health care utilization. The predictive accuracy of the Q-negative score was further evaluated using receiver operating characteristic (ROC) analysis.
Results. The Q-scale demonstrated high internal consistency, with Cronbach's alpha values of 0.890 (Q-negative) and 0.870 (Q-positive). There was a strong positive correlation between Q-negative scores and Kessler Screening Scale (Kessler-6) scores (r = 0.711, P < .001), validating the Q-scale's ability in predicting HO. The receiver operating characteristics (ROC) analysis showed the Q-negative score’s sensitivity at 70.4% and specificity at 61.2%, with an optimal cutoff of 11 (area under the curve = 0.71). Patients with high utilization, defined as patients with three or more hospital nights or urgent care encounters within the past 12 months, scored significantly higher on negative affect items (Wilcoxon W = 18,839,309, P < .001).
Conclusion. The Q-scale is a reliable, cost-effective tool for identifying patients at risk of HO in primary care settings. By assessing psychosocial, affective, and somatic factors, it enables early intervention for high-risk patients, reducing unnecessary health care utilization and associated costs. Future research should focus on broader population validation and longitudinal studies to further support the Q-scale's applicability across diverse demographics.
Introduction. Health care overutilization (HO) presents a significant challenge to health care systems worldwide, resulting in resource strain and diminished care quality due to unnecessary emergency department and urgent care visits for non-urgent issues.1 Current predictive tools for HO typically focus on isolated clinical factors or individual psychosocial elements, which limit their ability to capture the complex, multi-dimensional nature of HO. Existing methods fall short in the primary care setting, where efficient, cost-effective tools that can holistically address clinical and psychosocial dimensions are critically needed. Traditional claims-based scores, such as the Charlson Comorbidity Index, identify high utilizers almost exclusively from diagnostic codes and age, overlooking the psychosocial distress and functional limitations that often precipitate avoidable urgent-care visits.2 Likewise, discharge-derived tools like the LACE index, which combines the length of stay, acuity, comorbidity, and prior ED use, flag risk only after hospitalization and demonstrate only modest discrimination in the outpatient setting, limiting their usefulness for early, targeted intervention in primary care.3
This study addresses this gap by developing and validating the Q-scale, a novel predictive tool that evaluates a broader range of factors, including psychosocial, affective, and somatic domains, to assess HO risk more comprehensively. This research aims to establish the Q-scale as a reliable instrument in identifying high-risk patients early, allowing for targeted intervention strategies to reduce unnecessary health care use and improve resource allocation within primary care environments.
Previous studies have examined various factors that account for HO, including patient-related factors such as health literacy gaps, fear of disease, and misconceptions about health care.4,5 Provider-related factors may include defensive medicine approaches and financial rewards associated with volume-based care delivery models.6 Addressing HO requires not only understanding its causes but also implementing targeted strategies to mitigate its effects.
Efforts to improve care coordination, adopt evidence-based guidelines, and promote shared decision-making have reduced HO.7 Early identification of patients prone to HO through population screening is critical to reducing waste and optimizing resource allocation. However, identifying high HO individuals is challenging in resource-limited primary care settings.8,9 Current screening tools lack the specificity needed to capture complex utilization patterns, highlighting the need for new instruments that account for both clinical and psychosocial factors.10
Accordingly, this study aimed to develop and validate a novel survey-based instrument, the Q-scale, as a tool for identifying patients at risk in primary care and routine health care settings of HO. The Q-scale was initially conceived as an indicator of early warning signs within workplace health promotion settings in Australia, emphasizing a shift toward positive psychology. Unlike traditional tools that focus on psychopathology, the Q-scale was designed to assess psychological wellbeing and normal functioning in healthy populations. To adapt the instrument for frontline care, clinically actionable domains, such as sleep quality, perceived stress, and fatigue, were added to sharpen the detection of early-stage anxiety and depression. The instrument was also streamlined for rapid, automated use in clinical workflows, enabling point-of-care risk flags and real-time triage. Drawing from large-scale workplace health promotion initiatives, the Q-scale integrates positive aspects of life, such as sleep quality, life satisfaction, and self-confidence, aiming to support the overall mental and physical health of the target population. The research addresses existing gaps by creating and validating a reliable population health instrument for predicting individuals at risk within these health care environments.
Methods
Q-scale instrument development preliminary validation
The Q-scale was developed as a comprehensive instrument to assess overall well-being and Quality of Life (Q) by evaluating psychosocial, affective, and somatic factors. The Q-scale evaluates various factors influencing quality of life, such as sleep quality, family and social relationships, levels of worry, and self-perception. Moreover, the instrument, accessible via web and mobile platforms, consists of 10 ordinally ranked items (Table 1), reflecting respondents’ experiences over the past 4 weeks. Items address negative affect (six items) and positive affect (four items), scored on a scale of 1-5 (1 = none of the time, 2 = a little of the time, 3 = some of the time, 4 = most of the time, and 5 = all of the time). The scale yields two indices: Q-negative, where higher scores indicate greater psychosocial risk, and Q-positive, where higher scores suggest resilience and well-being.
Table 1. A list of 10 ordinally ranked items of the Q-scale

Preliminary validation of the Q-scale was conducted with 16 participants by comparing it to the General Health Questionnaire (GHQ-12) and the Kessler-10, both internationally validated instruments for assessing mental health and psychological distress, respectively.11,12 Significant concordance was observed between Q-scale and analogous items in the GHQ-12 and Kessler-10, particularly in domains such as depression (Kendall’s Tau, P < .001). This initial analysis supported the Q-scale’s preliminary validity to measure overall well-being, emphasizing its unique focus on integrating positive affect alongside traditional psychosocial risk indicators (e.g., feeling under strain, difficulty relaxing, or experiencing low mood).
At the time of the initial validation, the Kessler-6 had not yet been published. The Kessler-6 was designed to include the six items from the original Kessler-10 that were determined to be the most predictive of psychological distress, offering a more concise yet equally robust measure. Once the Kessler-6 was introduced, its efficiency and predictive accuracy made it a suitable tool, and our study evolved to incorporate this version in subsequent analyses.
Building on the preliminary validation findings, the Q-scale was validated in a larger sample of over 9000 participants from diverse primary care settings. The results of this expanded validation are detailed in the present research paper.
Study population
A total of 9997 patients 18 years of age or older (median age = 50; women 61%, men 39%) comprised the study population. Data was collected from 13 primary care sites representing eight different health plans. This varied sample allowed for a comprehensive analysis of the relationship between Q-scale scores and health care utilization.
Data collection
The Q-scale was administered to patients of primary care clinics in the Southeastern United States. Participants' self-reported health care utilization data was collected at the same time, including non-childbearing-related hospitalizations and urgent care encounters, for the previous 12 months. High hospital users were defined as those with 3 or more hospital nights, and high urgent care users as those with three or more encounters.
Statistical analysis
The statistical analysis employed multiple techniques to assess the Q-scale assessment's reliability, validity, and effectiveness. The reliability of the Q-scale was assessed using Cronbach's alpha, a measure of internal consistency. Specifically, Cronbach's alpha measured how closely related the individual items of the Q-negative and Q-positive were as groups. Correlations between assessment items were calculated to identify inter-item relationships. Factors were extracted based on eigenvalues greater than 1 and a scree plot. Cross-loadings and communalities were examined to ensure the robustness and reliability of the factor structure. Linear regression, logistic regression, and Pearson chi-square tests were conducted to explore relationships between variables, providing insights into continuous and categorical overutilization risk predictors. Descriptive statistics, including means and standard deviations, summarized the distribution of responses. The Wilcoxon rank-sum test was applied to compare median scores across groups, ensuring robustness for non-normally distributed data. Finally, the assessment's predictive accuracy was evaluated using ROC analysis.
Ethical considerations
This project was Protocol 30-094 approved by Lake Erie College of Osteopathic Medicine (LECOM) Institutional Review Board (IRB).
Results. Cronbach's alpha for the Q-scale, encompassing total negative and positive items, is 0.870. Individually, the alpha value for negative items is 0.890, while for positive items, it is 0.870. The correlation between the summed positive and summed negative items is 0.333. This indicates a statistically significant weak positive relationship between Q-negative and Q-positive scores. The correlation matrix includes means and standard deviations for Q-scale negative and positive items for the study population (Table 2).
Table 2. Correlation matrix of the raw scores of items from Q-scale negative and positive affect, means, and standard deviations.

N = 9997. All correlations were statistically significant (P < .001).
The correlation matrix illustrates the relationships between Q-scale items categorized into negative and positive affect domains. The matrix reveals notable internal consistencies within each domain, as evidenced by moderate to strong positive correlations among items within the negative effect group. For example, Unhappy and Depressed strongly correlates with Lost Interest (r = 0.672) and Strain and Pressure (r = 0.649), suggesting a shared underlying construct related to emotional distress.
For the positive effect, the highest correlations are observed between Feel Satisfied with Work and Feel Reasonably Happy with Life (r = 0.719), as well as Feel Satisfied with Work and Satisfied (r = 0.638). These results reflect the interconnectedness of items representing well-being and satisfaction. Notably, correlations between negative and positive affect items are relatively weaker, with most values below 0.350. For instance, Difficult to Relax correlates weakly with Satisfied (r = 0.104) and Feel Satisfied with Work (r = 0.198), underscoring the theoretical distinction between these affective dimensions.
Two factors were extracted, explaining a cumulative variance of 68%. Factor 1, negative effects, accounted for 45% of the variance and included variables such as "unhappy_and_depressed" (loading = 0.8), "lost_interest" (0.8), and "strain_and_pressure" (0.8). Factor 2, positive effects, explained 23% of the variance and consisted of items such as "feel_reasonably_happy_with_life" (loading = 0.9) and "feel_satisfied_with_my_work" (0.8).
Together, these two factors provide a comprehensive framework for understanding affective states. The clear separation between negative effects and positive affects highlights the bidirectional nature of emotional experiences. Importantly, the high loadings across both factors demonstrate the robustness of the factor structure, offering valuable insights into the interplay between distress and well-being. Communalities for all items exceeded 0.6, and no significant cross-loadings were observed.
The Kessler-6 has been used broadly to measure psychological distress and screen for mental health problems. The total study population (N = 9997) included 7549 patients who also completed the Kessler-6 screener at the same time. To assess the validity of the Q-scale, its scores were correlated with those from the Kessler-6, which is shown to reliably measure similar psychosocial characteristics. Table 3 depicts the correlation between Q-negative, Kessler-6 scores and Q-negative items (Table 3).
Table 3. Correlations of Q-negative, Kessler-6 Scores, and Q-negative items.

N = 7549. All correlations were statistically significant (P < .001).
As anticipated, the Q-negative total effect and the Kessler-6 scores (r = 0.711, P < .001) were highly correlated. This provides strong evidence of concurrent validity.
A logistic regression model identified the Q-negative effect indicators as a statistically significant independent predictor of HO with an odds ratio of 1/12 (95% CI 1.11-1.13; P<.001). Specifically, pain and lack of interest were identified as independent predictors of high utilization (P < .05). The model revealed that patients with high utilization, patients who spent 3 nights or more in the hospital or had three urgent care encounters within the last 12 months, exhibited higher Q-negative scores compared to low utilizers (Figure 1).
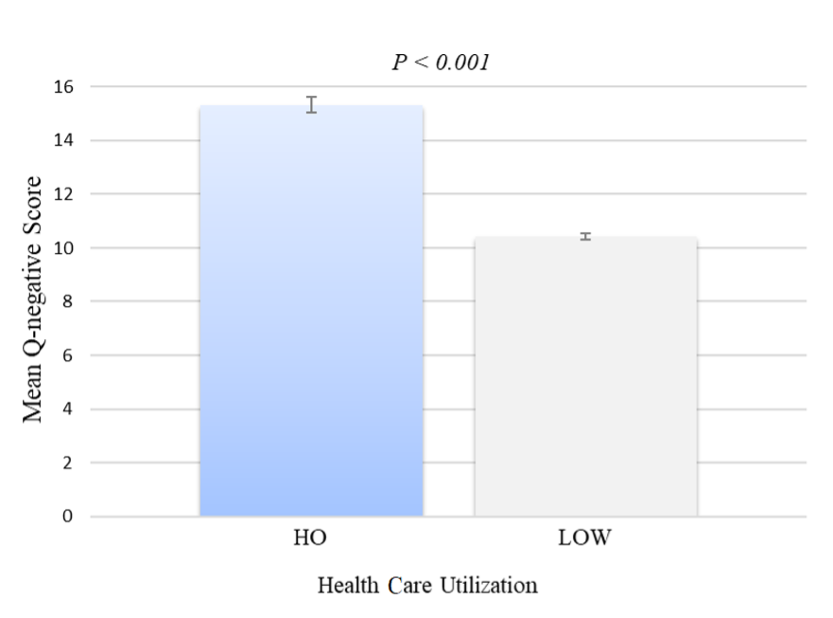
Figure 1. Health care utilization in all health care settings.
N= 9997. Health care utilization includes settings such as urgent care and hospitals. Error bars indicate 95% confidence interval.
The Wilcoxon rank-sum test showed a statistically significant difference in Q-positive scores between high and low utilizers (W = 18,839,309, P < .001). The rank-biserial correlation (r = 0.771) indicates a large effect size, suggesting that patients with high utilization scores are significantly different from low utilizers on positive affect. Specifically, patients with high utilization scored lower on Q-positive affect indicators, suggesting a reduced presence of positive emotional states during their health care experiences. Conversely, patients with low utilization scores scored lower on Q-negative affect indicators. The results highlight the potential value of the Q-scale in predicting HO and its role in identifying patients with high-risk characteristics.
Using a Receiver Operating Characteristic (ROC) analysis, the Q-negative demonstrated good sensitivity (70.4%) and specificity (61.2%) at an optimal cutoff score of 11. This means it can accurately identify a significant proportion of patients with high utilization (true positives) while also correctly identifying those who are not patients with high utilization (true negatives). The ROC curve depicts the trade-off between sensitivity and specificity at various threshold levels (Figure 2). The area under the curve (AUC) quantifies this overall ability, with the Q-negative showing robust performance (AUC = 0.71).
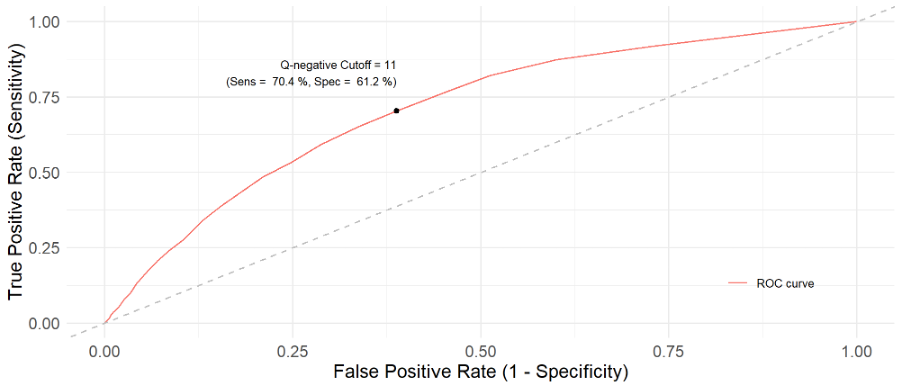
Figure 2. ROC Curve
N = 9997, AUC = 0.71, Q-negative Cutoff = 11.
Discussion. The primary objective of this study was to develop and validate the Q-scale as an effective tool for predicting health care overutilization. The findings demonstrate that the Q-scale exhibits good initial validity and is a reliable predictor of patients at risk of over or excess utilization. The results of the present study may have meaningful implications for identifying high risk individuals based on psychosocial, affective, and somatic factors, enabling early intervention, and reducing the burden of excessive health care use. The results suggest that the Q-scale has the potential to not only improve patient outcomes by efficiently identifying at risk patients with high health care overutilization at earlier stages, but also to revolutionize health care resource management, inspiring a new era of efficient data-driven patient-centered care. A high Q-negative score reflects diminished well-being and should prompt integrative, patient-centered interventions. While not a therapeutic target, it can guide providers toward supportive actions such as behavioral screening, patient education, and wellness promotion. The Q-scale is an early indicator within holistic care models rather than a trigger for isolated clinical referrals.
In alignment with prior literature, the present study confirms the importance of psychosocial determinants in predicting HO. Similar to findings by Capp et al.7 and Hunt et al.8, which emphasize the impact of psychosocial factors on health care patterns, the Q-scale’s ability to assess psychosomatic and affective domains further reinforces the significance of these factors in predicting HO. This predictive capacity is particularly valuable in distinguishing high-risk patients early, as recognized in prior studies.
While this study establishes the Q-scale as a promising predictive tool for identifying patients at high risk of HO, certain limitations must be acknowledged. The study sample, though representative of application in primary care settings, requires broader validation across diverse populations to confirm its generalizability. Additionally, the study’s cross-sectional design does not allow for assessment of the Q-scale’s predictive accuracy over time. Future studies should focus on expanding the application of the Q-scale in varied demographic groups and conducting longitudinal research to track its predictive effectiveness and long-term utility.
To maximize its practical application, more primary care clinics should consider integrating the Q-scale into routine primary care assessments. Low-cost interventions based on early Q-scale detection, such as psychosocial support, chronic disease management, and patient self-management and self-care education, can help mitigate excessive health care use and improve patient care outcomes saving money for the entire system. Further investigation of the Q-scale through collaborative efforts between clinicians, researchers, and platform developers will be critical in refining its precision and expanding its use across different health care settings
Conclusion. In conclusion, this study highlights the Q-scale's practical utility as a reliable, cost-effective tool for identifying patients at risk for health care overutilization by assessing psychosocial, affective, and somatic domains. With its ease of integration into primary care settings, the Q-scale offers significant potential for improving resource allocation, reducing unnecessary health care use, and informing targeted interventions for high-risk individuals. Future research should focus on longitudinal studies to assess the Q-scale's predictive accuracy over time and applicability across diverse populations and health care environments. Expanding the Q-scale's use in clinical workflows and mobile-based applications could further refine its role in supporting efficient, patient-centered care in various health care settings.
AUTHORS:
Ashley Matejka, DHA, MBA1 • Syed A. A. Rizvi, MD, PhD, MPH2 • Bishoy Goubran MD3 • Frank D. Fincham, PhD4 • Juan Oms, MD, FAPA5 • Marcos A. Sanchez-Gonzalez, MD, PhD, MSMed1,5,6 • Troy Grogan1
AFFILIATIONS:
1Research & Development, QHSLab, Inc, West Palm Beach, FL, USA
2 College of Biomedical Sciences, Larkin University, Miami Gardens, FL, USA
3Department of Psychiatry, Child and Adolescent Fellowship. Rush University Medical Center, Chicago, IL
4Family Institute, Florida State University, Tallahassee, FL, USA
5Department of Psychiatry, Southern Winds Hospital, Miami, FL, USA
6School of Health Services Administration, Lake Erie College of Osteopathic Medicine, Bradenton, FL, USA
CITATION:
Scale-based scores are linked to health care overutilization in the primary care setting: development and validation of the Q-scale. Consultant. Published online May 30, 2025. doi:10.25270/con.2025.05.000006.
Received December 13, 2024. Accepted March 8, 2025.
DISCLOSURES:
The authors report no relevant financial relationships.
ACKNOWLEDGEMENTS:
The authors wish to express their gratitude to Professor Ross Harris, Dr. Mary Harris, and Dr. David Harris for their foundational work in the conceptualization, development, and early validation of the Q-Scale.
References
1. Segal JB, Sen AP, Glanzberg-Krainin E, Hutfless S. Factors associated with overuse of health care within us health systems: a cross-sectional analysis of medicare beneficiaries from 2016 to 2018. JAMA Health Forum. 2022;3(1):e214543-e214543. doi:10.1001/jamahealthforum.2021.4543
2. Charlson ME, Pompei P, Ales KL, MacKenzie CR. A new method of classifying prognostic comorbidity in longitudinal studies: development and validation. J Chronic Dis. 1987;40(5):373-83. doi:10.1016/0021-9681(87)90171-8
3. van Walraven C, Dhalla IA, Bell C, et al. Derivation and validation of an index to predict early death or unplanned readmission after discharge from hospital to the community. CMAJ. Apr 6 2010;182(6):551-7. doi:10.1503/cmaj.091117
4. Shaffer VA, Scherer LD. Too much medicine: behavioral science insights on overutilization, overdiagnosis, and overtreatment in health care. Policy Insights Behav Brain Sci. 2018;5(2):155-162. doi:10.1177/2372732218786042
5. Berkman ND, Sheridan SL, Donahue KE, Halpern DJ, Crotty K. Low health literacy and health outcomes: an updated systematic review. Ann Intern Med. 2011/07/19 2011;155(2):97-107. doi:10.7326/0003-4819-155-2-201107190-00005
6. Albarqouni L, Arab-Zozani M, Abukmail E, et al. Overdiagnosis and overuse of diagnostic and screening tests in low-income and middle-income countries: a scoping review. BMJ Global Health. 2022;7(10):e008696. doi:10.1136/bmjgh-2022-008696
7. Capp R, Misky GJ, Lindrooth RC, et al. Coordination program reduced acute care use and increased primary care visits among frequent emergency care users. Health Aff (Millwood). 2017;36(10):1705-1711. doi:10.1377/hlthaff.2017.0612
8. Hunt KA, Weber EJ, Showstack JA, Colby DC, Callaham ML. Characteristics of frequent users of emergency departments. Ann Emerg Med. 2006;48(1):1-8. doi:10.1016/j.annemergmed.2005.12.030
9. Tsai M-H, Xirasagar S, Carroll S, et al. Reducing high-users’ visits to the emergency department by a primary care intervention for the uninsured: a retrospective study. Inquiry. 2018;55:0046958018763917. doi:10.1177/0046958018763917
10. Müskens JLJM, Kool RB, van Dulmen SA, Westert GP. Overuse of diagnostic testing in healthcare: a systematic review. BMJ Qual Saf. 2022;31(1):54-63. doi:10.1136/bmjqs-2020-012576
11. Goldberg D, Williams P. A User's Guide to the General Health Questionnaire (GHQ). NFER-Nelson; 1988.
12. Kessler RC, Andrews G, Colpe LJ, et al. Short screening scales to monitor population prevalences and trends in non-specific psychological distress. Psychol Med. Aug 2002;32(6):959-76. doi:10.1017/s0033291702006074