
US Adult Obesity Prevalence Projected to Reach 46.9% by 2035
Key Highlights
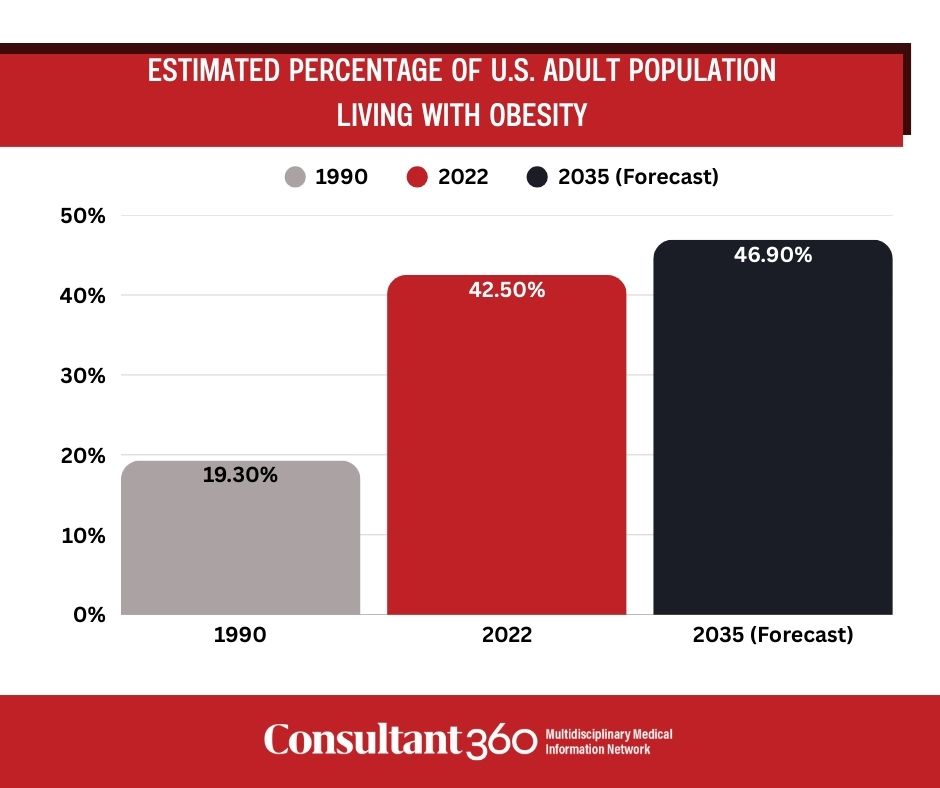
- The national adult obesity prevalence (BMI ≥30) increased from 19.3% in 1990 to 42.5% in 2022 and is forecast to reach 46.9% by 2035.
- In 2022, an estimated 107 million US adults were living with obesity; projections estimate 126 million by 2035.
- State-level prevalence varied widely, with higher levels concentrated in Midwestern and Southern states and larger within-state disparities for women than men.
Adult obesity prevalence in the United States more than doubled from 1990 to 2022 and is projected to keep increasing through 2035, according to a cross-sectional analysis published online in JAMA. Investigators reported substantial variation by state, race and ethnicity group, sex, and age, highlighting persistent disparities in the burden of obesity.
Using modeled estimates derived from multiple national surveys, the analysis estimated that 42.5% of US adults were living with obesity in 2022, up from 19.3% in 1990, and forecasted a rise to 46.9% by 2035. The authors noted that detailed, population-level estimates and projections are needed to inform health policy and efforts to reduce inequities.
Methods
Researchers analyzed measured body mass index (BMI) data from the National Health and Nutrition Examination Survey (NHANES) and bias-corrected BMI values derived from self-reported height and weight from the Behavioral Risk Factor Surveillance System (BRFSS) and the Gallup Daily Survey. Self-report bias was addressed by matching mean self-reported BMI to mean measured BMI in NHANES by sex, survey year, age group, race and ethnicity group, and self-reported BMI quantiles, then applying model-based corrections.
To generate estimates from 1990 to 2022, the team used a 3-stage spatiotemporal gaussian process regression (ST-GPR) framework. Forecasts from 2022 through 2035 used an ensemble approach combining annualized rate-of-change models and meta-regression bayesian spline models with varying recency weights. Obesity prevalence was defined as BMI ≥30. Results were reported for Hispanic (any race), non-Hispanic Black, and non-Hispanic White populations.
Study Findings
In 2022, the analysis estimated 107 million US adults (95% uncertainty interval [UI], 101-113) were living with obesity, representing 42.5% (95% UI, 40.2%-45.0%) of the adult population. In 1990, an estimated 34.7 million adults (95% UI, 31.1-38.3) were living with obesity, or 19.3% (95% UI, 17.3%-21.3%) of the adult population. By 2035, obesity prevalence was forecast to reach 46.9% (95% UI, 43.9%-49.9%), corresponding to 126 million adults (95% UI, 118-134).
Nationally, age-standardized obesity prevalence by race and ethnicity group and sex in 2022 ranged from 40.1% (95% UI, 37.8%-42.5%) for non-Hispanic White men to 56.9% (95% UI, 54.1%-59.9%) for non-Hispanic Black women. Hispanic women had an estimated prevalence of 49.4% (95% UI, 46.3%-52.4%) in 2022. Severe obesity (BMI ≥40) was higher among females than males across groups, reaching 20.2% (95% UI, 18.5%-21.9%) among non-Hispanic Black females.
State-level patterns showed obesity prevalence was highest in Midwestern and Southern states, with within-state disparities by race and ethnicity group larger for women than men. Among the Hispanic population in 2022, obesity prevalence was highest in Oklahoma for women (54.0% [95% UI, 50.3%-57.6%]) and Indiana for men (47.2% [95% UI, 42.8%-51.7%]). For non-Hispanic White adults, prevalence in 2022 was lowest in the District of Columbia (23.8% [95% UI, 21.3%-26.2%] for men; 25.9% [95% UI, 23.8%-28.1%] for women) and highest in West Virginia (47.2% [95% UI, 44.7%-49.9%] for men; 48.9% [95% UI, 46.9%-51.0%] for women). Among non-Hispanic Black women, the estimated prevalence exceeded 50% in all locations except Hawaii in 2022 (48.5% [95% UI, 45.0%-52.1%]) and was forecast to exceed 50% in all locations by 2035.
Clinical Implications
According to the authors, differences in obesity prevalence across population groups can inform health policy and interventions to reduce inequities and the overall burden of obesity in the United States. They also stated that these estimates provide insight into future obesity levels if past trends continue and may help identify effective policies by examining populations with consistently lower prevalence rates.
Key limitations noted by the authors include that forecasts must be interpreted with caution, as past trends may not predict the future, and that the analysis relied on self-reported height and weight data, which were adjusted using NHANES data but could not account for potential state-level differences in self-report bias.
Expert Commentary
“Using nationally representative surveys and robust modeling approaches, this study estimated that the percent of US adults living with obesity increased from 19.3% (95% UI, 17.3%-21.3%) in 1990 to 42.5% (95% UI, 40.2%-45.0%) in 2022 and that this will rise to 46.9% (95% UI, 43.9%-49.9%) by 2035, with substantial variation by location and race and ethnicity group,” the researchers concluded.
Reference
DeCleene NK, Kahn E, Yuan C-W, et al. US state-level prevalence of adult obesity by race and ethnicity from 1990 to 2022 and forecasted to 2035. JAMA. Published online January 28, 2026. doi:10.1001/jama.2025.26817